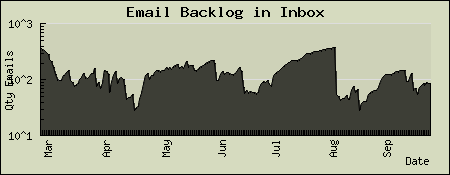
Email Backlog Graphs
This is what my email inbox has looked like for the last several months. I admit it – I use my inbox as a storage device. I do the same thing with my desktops, both virtual and physical.
It’s interesting to see how, no matter how hard I tried at cleaning out the box, there is always a “hum” going on of messages that just came in, messages that go with current issues at work, and messages I just don’t want to throw out or know where to file. It’s normal for me to get 50-75 emails per day, so having that many in the box doesn’t seem that odd to me.
One of the things I have noticed is that back-date spam (spam that has the wrong date and tries to hide in your stack of emails) accumulates and artificially inflates the graph. Since I don’t use a spam filter on my personal account, those start to pile up after a while. When I finally clean them out, it contributes to the “crash” seen every six weeks or so.
Another issue that builds the number of emails up are multiple messages from clients that pertain to the same issue. I can’t seem to get clients to put the information on the ticket that it goes with. So, perhaps I should start making temporary file folders for each ticket, or take it upon myself to add the details to the ticket. That would work for clients where I charge by the hour, I guess, as it would add up to an extra $200 or so per month just to keep them organized.
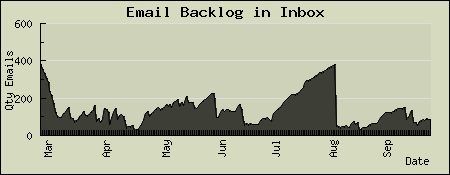
Finally, I find myself preferring the logarithmic graph below. It keeps the extremes of vacation-buildup, etc. from drowning out the daily din. It makes me feel like there is a lot of stuff there and that I should clean it out more often and makes smaller amounts of mail seem more significant. This is really interesting because the hard-to-deal-with messages just never go away and become part of that daily din.